


Even holders of the same crypto assets (also known as virtual currencies) can have very different experiences depending on their approach: simply holding for the long term ("HODLing") versus depositing assets to earn rewards through staking. So which style is more common, and how much do returns and satisfaction actually differ between the two?
Clabo surveyed 600 crypto asset holders to find out. This article breaks down the self-reported data — the split between investment styles, the reasons people avoid staking, perceived returns and satisfaction by style, and the rewards holders are actually earning.
*The figures in this article are aggregated from respondents' self-reported answers.
1. Crypto Holders' Investment Styles: "HODL Only" Leads at 45%
When asked about their investment style, "HODL (long-term holding) only" was the most common response at 44.7%. Combining "practicing staking" (17.3%) and "doing both" (17.7%), 35.0% of respondents are engaged in staking in some form.
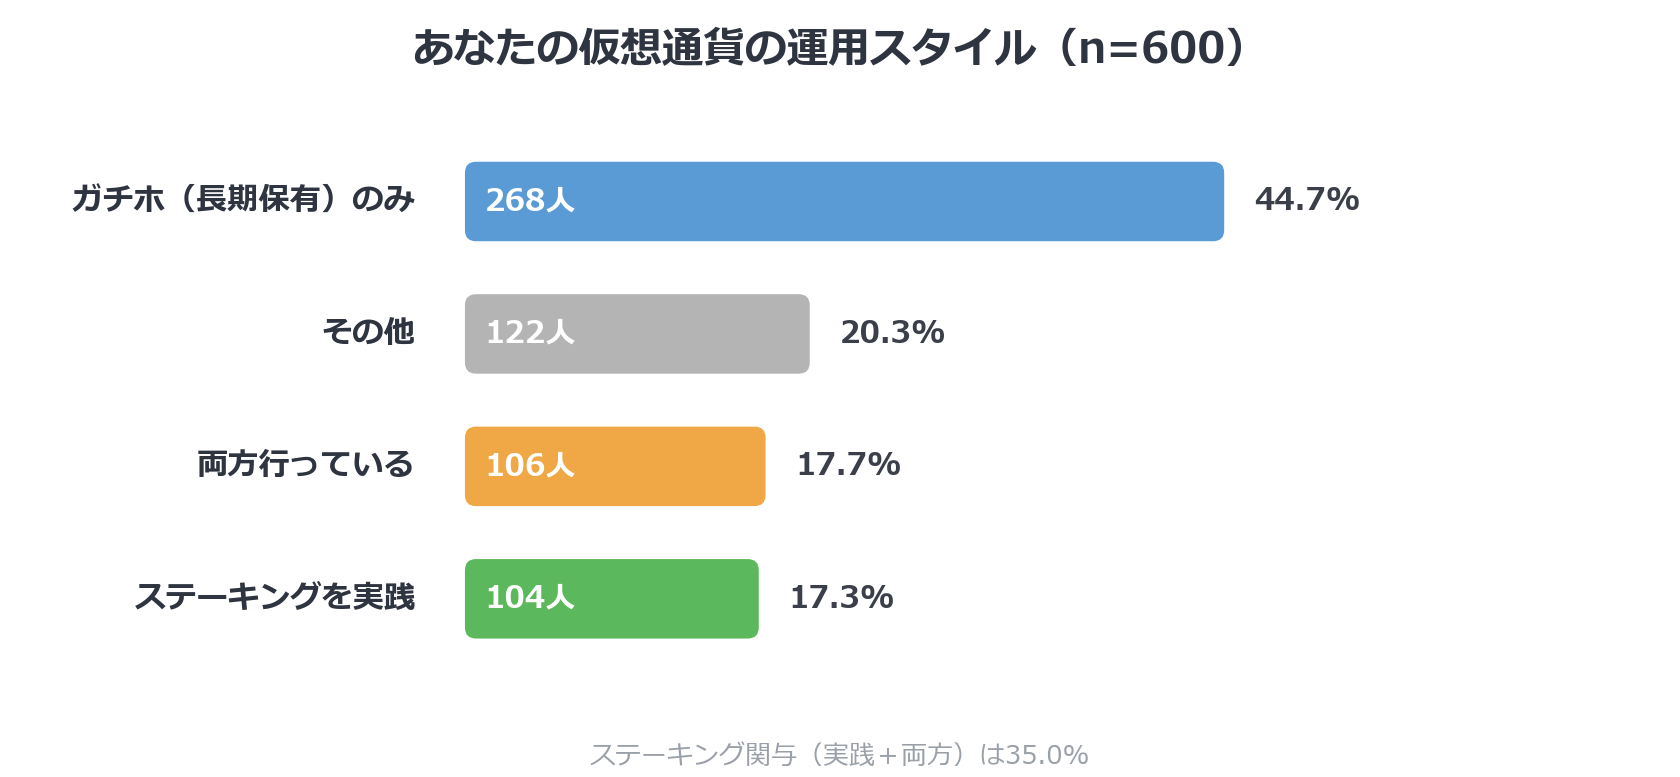
1-1. Breakdown of Investment Styles (n=600)
Investment Style | Responses | Percentage |
|---|---|---|
HODL (long-term holding) only | 268 | 44.7% |
Other | 122 | 20.3% |
Doing both | 106 | 17.7% |
Practicing staking | 104 | 17.3% |
1-2. Staking Experience (n=600)
Experience | Responses | Percentage |
|---|---|---|
Not practicing | 216 | 36.0% |
2+ years | 160 | 26.7% |
1–2 years | 148 | 24.7% |
Under 1 year | 76 | 12.7% |
2. Why People Avoid Staking: 54% Say They "Don't Understand How It Works"
Among the 216 respondents who don't stake, "I don't understand how it works" stood out at 54.2%. More specific concerns, such as "rewards are too low" (14.8%) or "worried about the lock-up period" (12.0%), were far less common. The main barrier isn't a cost-benefit calculation — it's the difficulty of getting started.
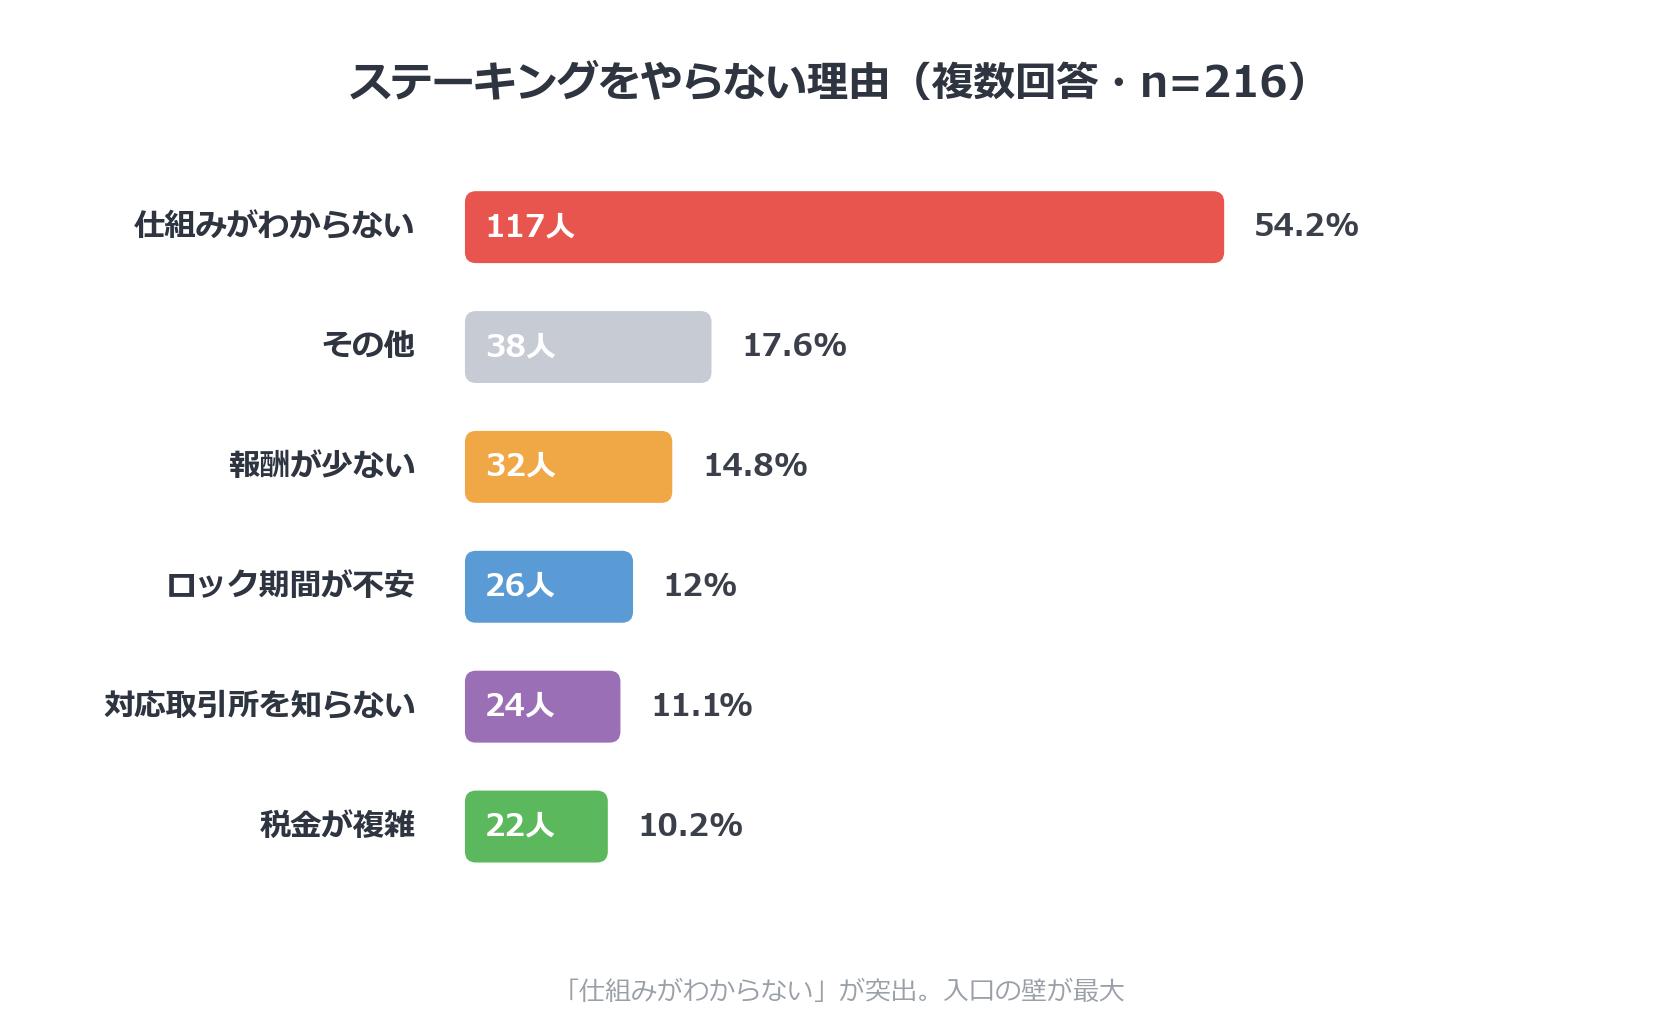
Reasons for not staking (multiple answers, n=216) | Responses | Percentage |
|---|---|---|
Don't understand how it works | 117 | 54.2% |
Other | 38 | 17.6% |
Rewards are too low | 32 | 14.8% |
Worried about the lock-up period | 26 | 12.0% |
Don't know which exchanges support it | 24 | 11.1% |
Taxes are too complicated | 22 | 10.2% |
3. Perceived Returns Vary by Investment Style
Perceived returns over the past year centered on "0–5%" (23.8%) and "5–10%" (21.3%). "I don't know" was also common at 21.2%, while 18.0% reported negative returns.
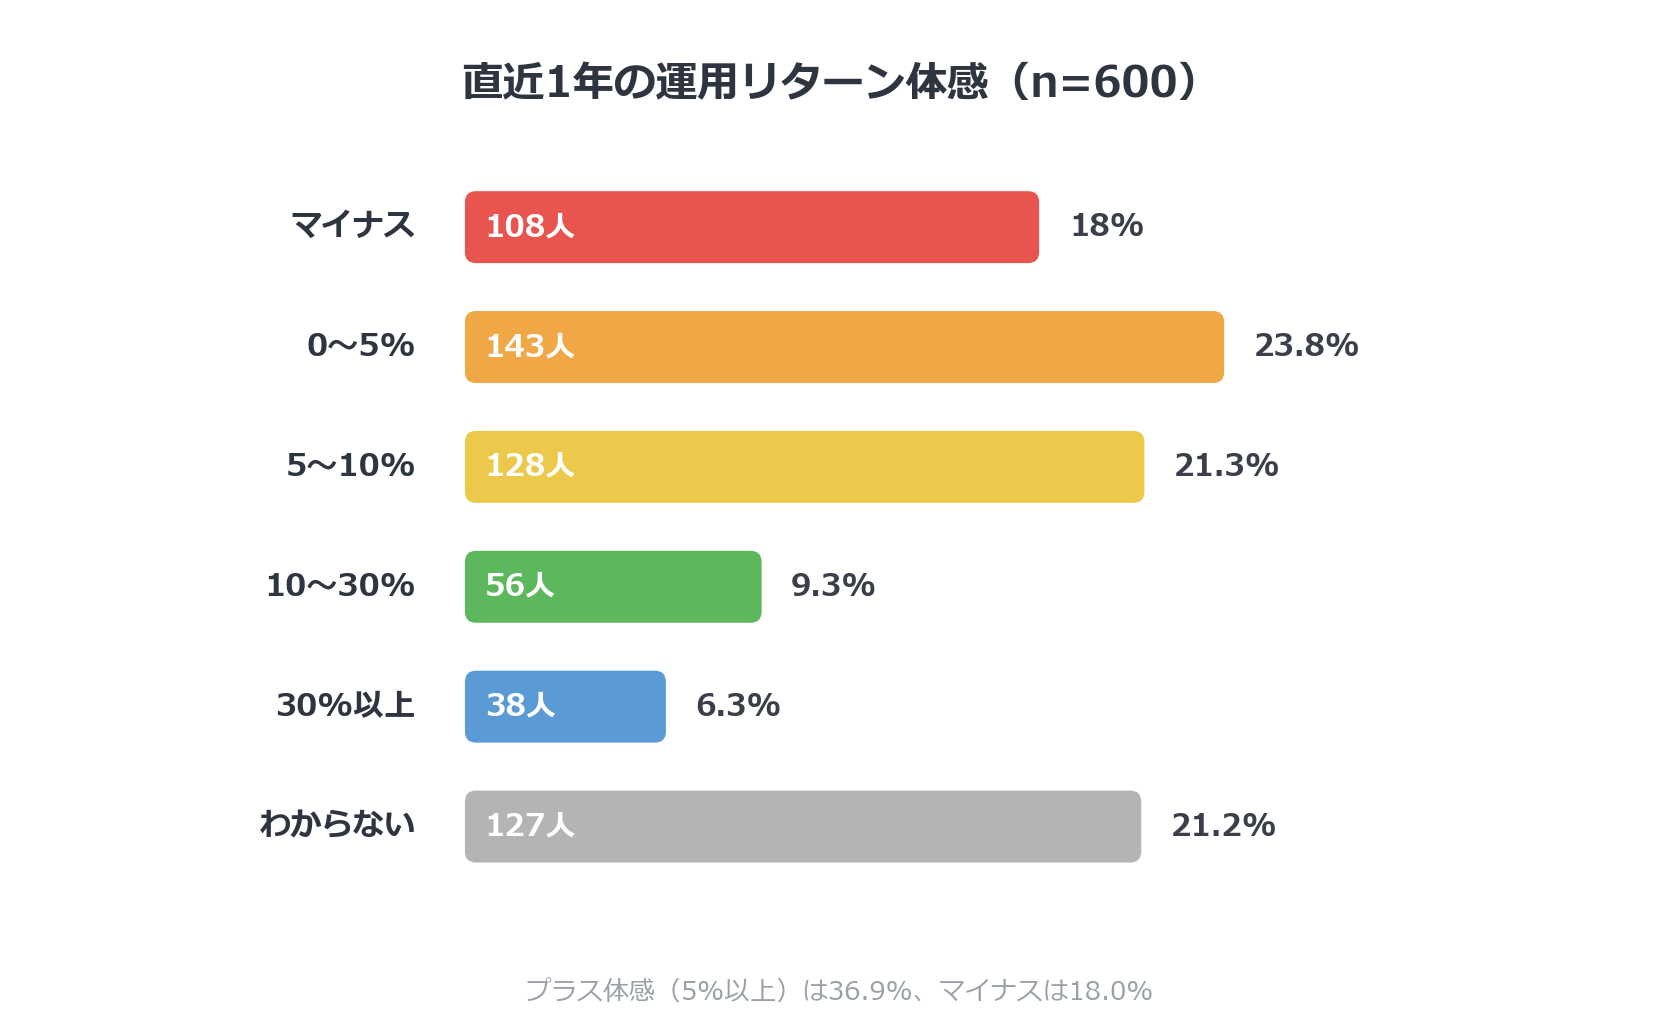
3-1. Distribution of Perceived Returns (n=600)
Perceived Return | Responses | Percentage |
|---|---|---|
Negative | 108 | 18.0% |
0–5% | 143 | 23.8% |
5–10% | 128 | 21.3% |
10–30% | 56 | 9.3% |
30%+ | 38 | 6.3% |
Don't know | 127 | 21.2% |
3-2. By Style, Staking Practitioners Report the Most Positive Returns
Cross-tabulated by style, 43% of staking practitioners reported returns of "5–10%." Among the HODL-only group, "negative" returns were relatively common at 22%, while 54% of the "other" group answered "don't know."
Perceived Return by Style | HODL only | Staking | Both | Other |
|---|---|---|---|---|
Negative | 22% | 9% | 15% | 20% |
5–10% | 19% | 43% | 23% | 7% |
Don't know | 18% | 8% | 4% | 54% |
4. Staking Rewards: "¥50,000–100,000" Is the Most Common Range
Among the 210 respondents practicing staking, the most common total reward amount received over the past year was "¥50,000–100,000" (32.9%; approx. USD 320–640), followed by "¥100,000–300,000" (19.0%). Note that staking rewards are generally taxable as miscellaneous income in Japan.
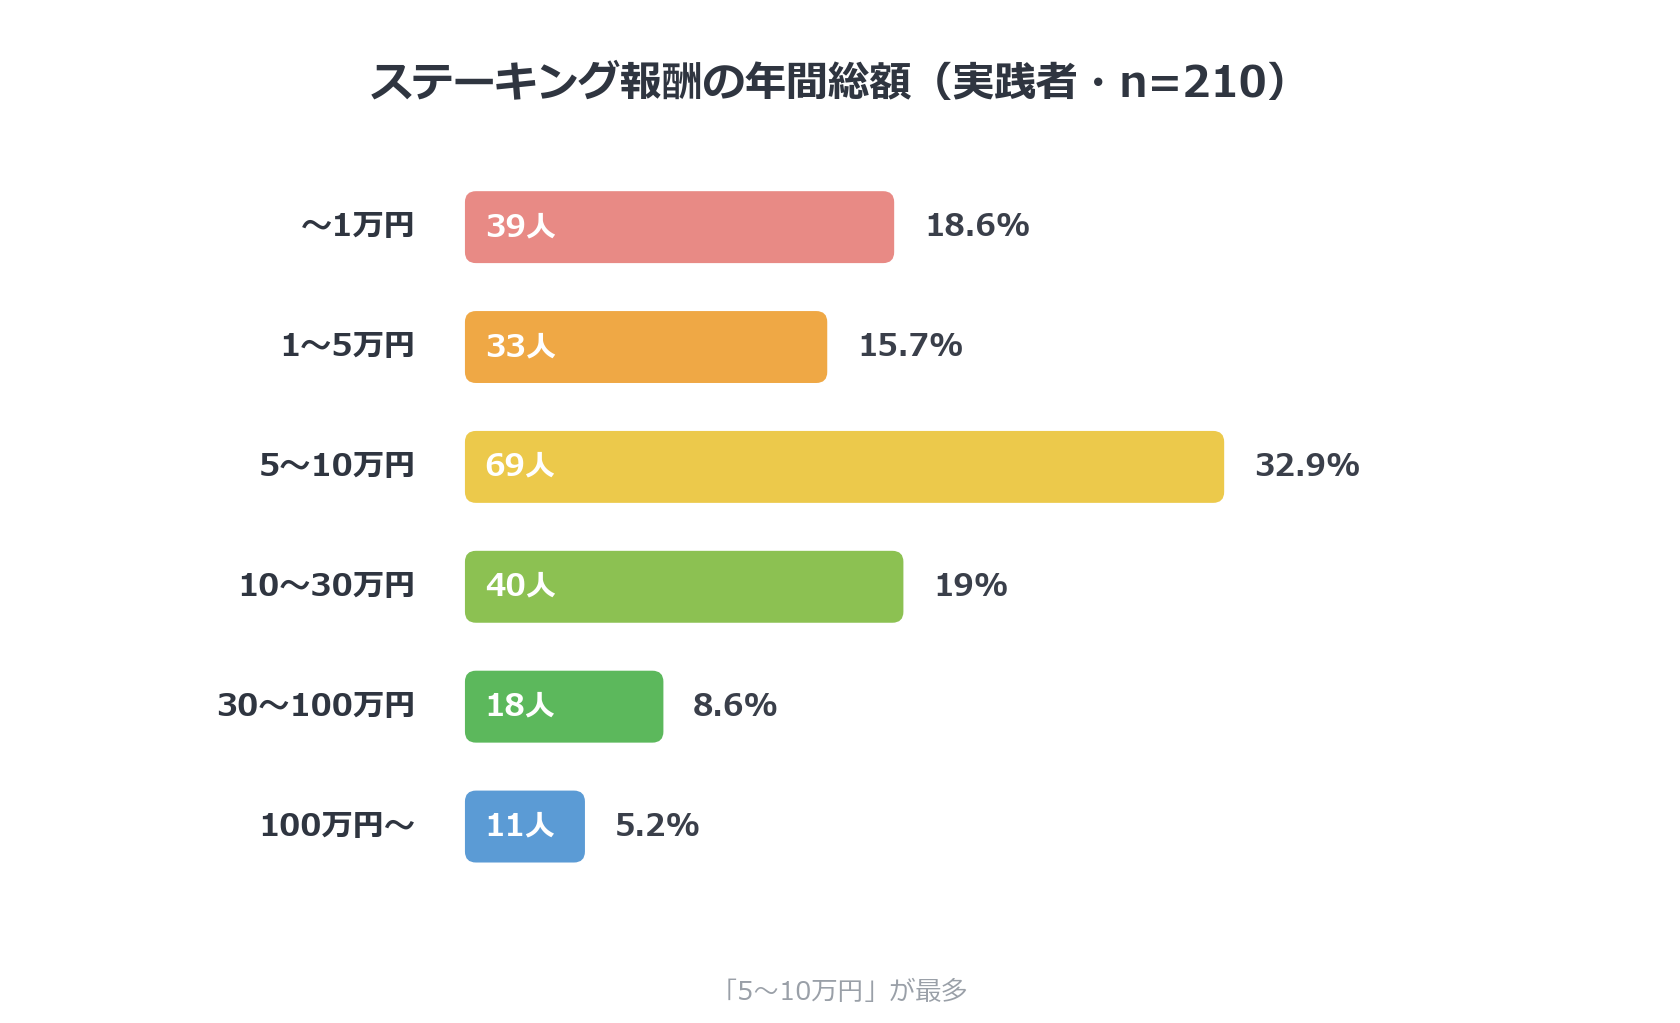
4-1. Total Annual Rewards (Staking Practitioners, n=210)
Total Annual Reward | Responses | Percentage |
|---|---|---|
Up to ¥10,000 | 39 | 18.6% |
¥10,000–50,000 | 33 | 15.7% |
¥50,000–100,000 | 69 | 32.9% |
¥100,000–300,000 | 40 | 19.0% |
¥300,000–1,000,000 | 18 | 8.6% |
¥1,000,000+ | 11 | 5.2% |
4-2. Longer Investment Experience Correlates with Higher Rewards
Cross-tabulated by years of investing experience, 45% of respondents with 10+ years of experience earned "¥300,000 or more," while 45% of those with 1–3 years of experience earned only "up to ¥10,000."
Reward by Investment Experience | 1–3 years | 3–5 years | 5–10 years | 10+ years |
|---|---|---|---|---|
Up to ¥10,000 | 45% | 16% | 9% | 10% |
¥300,000+ | 8% | 4% | 15% | 45% |
5. Satisfaction Is Highest Among Those Who Do Both
Satisfaction with current investment style was led by "neutral" at 53.2%. Combined satisfaction ("very satisfied" + "somewhat satisfied") came to 30.2%.
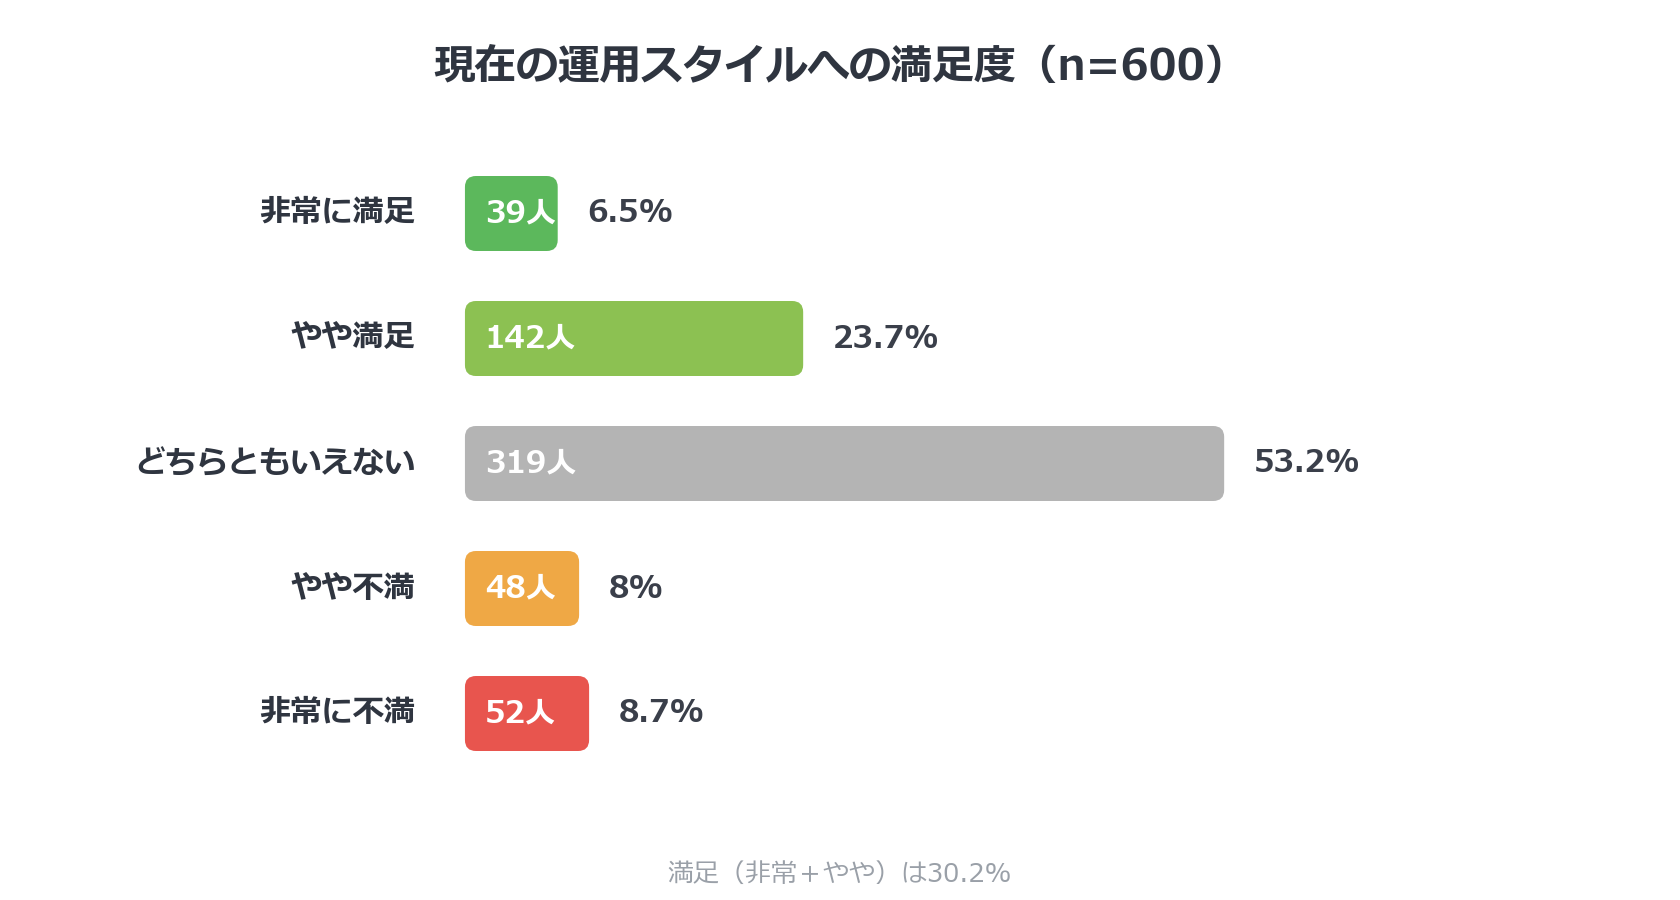
5-1. Distribution of Satisfaction (n=600)
Satisfaction | Responses | Percentage |
|---|---|---|
Very satisfied | 39 | 6.5% |
Somewhat satisfied | 142 | 23.7% |
Neutral | 319 | 53.2% |
Somewhat dissatisfied | 48 | 8.0% |
Very dissatisfied | 52 | 8.7% |
5-2. By Style, Those Doing Both Are the Most Satisfied
Looking at satisfaction by style, the "doing both" group had the highest satisfaction rate at 46%, compared with 33% for HODL-only and 32% for staking practitioners. Meanwhile, the "other" group had a notably higher rate of "very dissatisfied" responses at 19%.
Satisfaction by Style | HODL only | Staking | Both | Other |
|---|---|---|---|---|
Satisfied (very + somewhat) | 33% | 32% | 46% | 9% |
Very dissatisfied | 7% | 2% | 7% | 19% |
6. Summary
This survey revealed the following about investment styles:
- "HODL only" was the most common investment style at 44.7%. Staking involvement (practicing + doing both) totaled 35.0%.
- The top reason for avoiding staking was "I don't understand how it works," at 54.2%.
- Perceived returns varied by style: 43% of staking practitioners reported "5–10%," while 22% of the HODL-only group reported negative returns.
- The most common staking reward range was "¥50,000–100,000." Among those with 10+ years of investing experience, 45% earned "¥300,000 or more."
- Satisfaction with investment style was highest among those "doing both," at 46%.
7. Survey Overview
- Survey title: HODL vs. Staking (a study of investment styles)
- Conducted by: Clabo Inc.
- Method: Online self-administered survey
- Respondents: Men and women who hold crypto assets
- Valid responses: 600
- Conducted: May 2026
- Note: The figures in this article are based on respondents' self-reported answers. Percentages for multiple-answer questions may exceed 100%.
Charts and figures may be quoted or reproduced provided the source is credited as "Clabo Inc. survey."
8. Main Survey Questions
Q1 Which of the following best describes your crypto asset investment style?
Q2 How long have you been investing in crypto assets?
Q3 Please select all the assets you currently hold or use for staking.
Q4 How long have you been practicing staking?
Q5 Please select all reasons that apply for not staking.
Q6 Which best describes your perceived overall return on crypto investments over the past year?
Q7 What was your total staking reward amount over the past year?
Q8 How satisfied are you with your current investment style?
Q9 What is your total investment asset amount (including crypto assets)?
Q10 Which best describes your position/stance on crypto and investing?
Q11 What is your reason for continuing to HODL, or what motivated you to start staking?
This article is for informational purposes only and does not constitute financial or investment advice. Please consult a qualified professional before making investment decisions.


